Real-time statistics with Graphite, Statsd, and GDash
We have a Graphite-based stack of real-time visualization tools, including the data aggregator Statsd. These tools let us easily record real-time data from arbitrary services with mimimal fuss. We present some curated graphs through GDash, a simple Sinatra front-end.
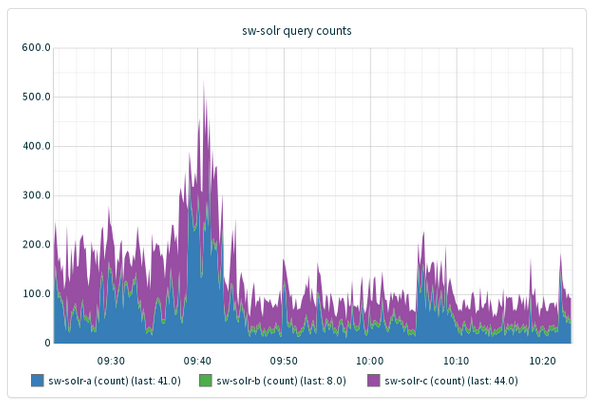
For example, we record the time it takes for Solr to respond to queries from our SearchWorks catalog, using this simple bash script:
(We rotate these logs through truncation; you can also use `tail -f --retry` for logs that are moved away when rotated)
And the ruby script that does the actual parsing:
require'statsd.rb'STATSD=Statsd.new(...,8125)# Listen to stdinwhilestr=getsifstr=~/QTime=([^ ]+)/# extract the QTimems=$1.to_i# record it, based on our hostnameSTATSD.timing("#{ENV['HOSTNAME'].gsub('.','-')}.solr.qtime",ms)endend
From this data, we can start asking qustions like:
Is our load-balancer configured optimally? (hint: not quite; for a variety of reasons, we've sacrificed some marginal performance benefit for this non-invasive, simpler load-blaance configuration.Why are our the 90th-percentile query times creeping up? (time in ms)
(Answers to these questions and more in a future post, I'm sure.)
We also use this setup to monitor other services, e.g.:
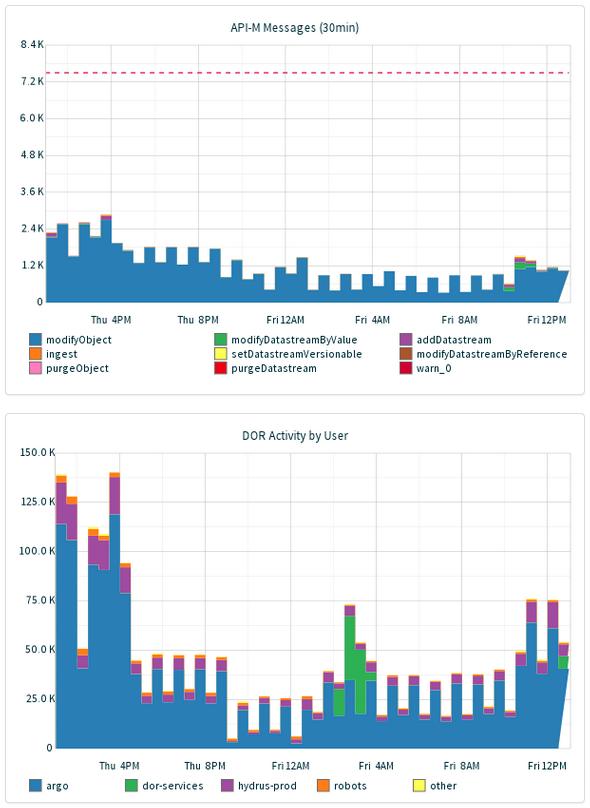
What's happening in our Fedora instance (and, which services are using the repository)?
Note the red line ("warn_0") in the top graph. It marks the point where our (asynchronous) indexing system is unable to keep up with demand, and updates may appear at a delay. Given time (and sufficient data, of course), this also gives us the ability to forecast and plan for issues:
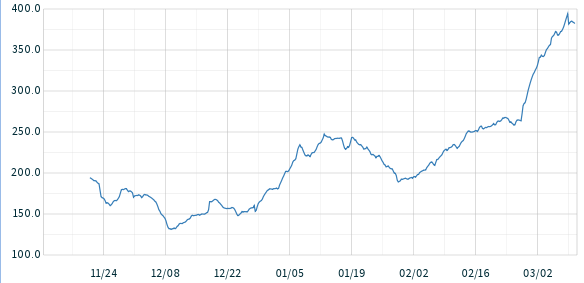
Is our Solr query time getting worse? (Ganglia can perform some basic manipulation, including taking integrals and derivatives)
What is the rate of growth of our indexing backlog, and, can we process it in a reasonable timeframe, or should we scale the indexer service?
Given our rate of disk usage, are we on track to run out of disk space this month? this week?
If we build graphs to monitor those conditions, we can add Nagios alerts to trigger service alerts. GDash helpfully exposes a REST endpoint that lets us know if a service has those WARN or CRITICAL thresholds.
We currently have a home-grown system monitoring system that we're tempted to fold into here as well. I've been evaluating Diamond, which seems to do a pretty good job of collecting granular system statistics (CPU, RAM, IO, Disk space, etc).